
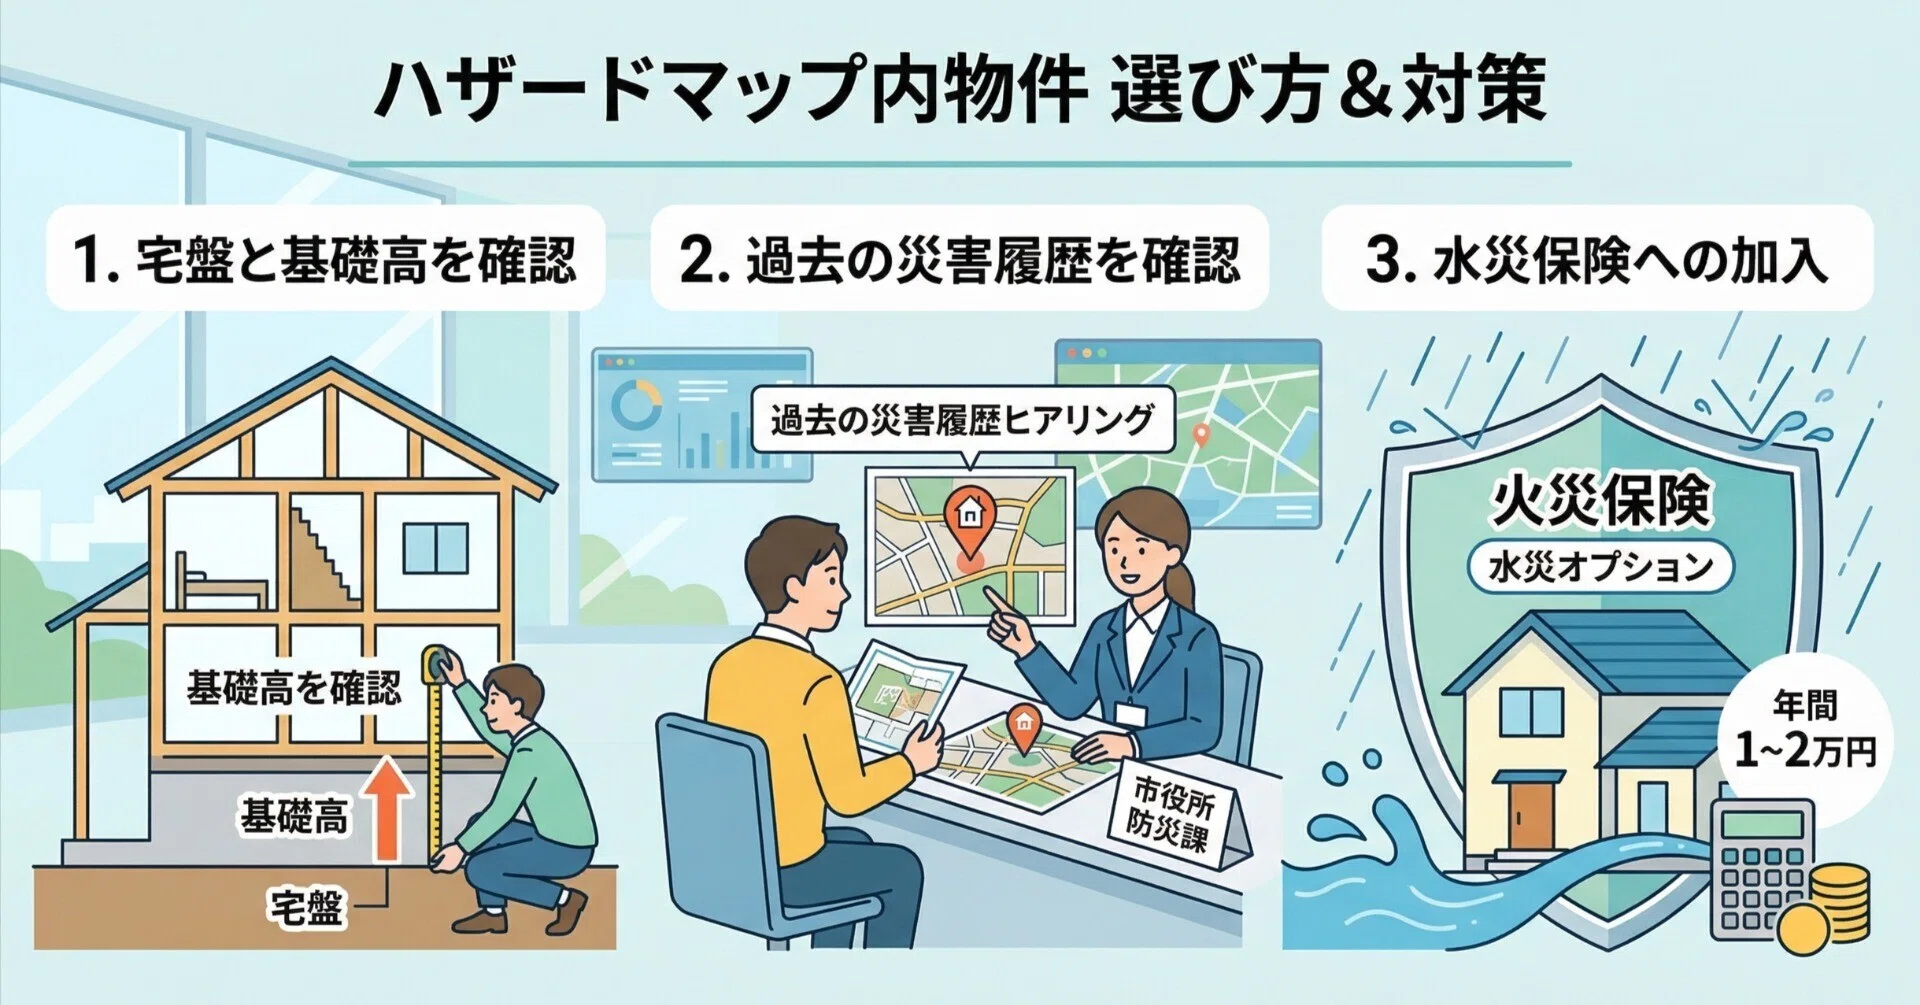
How to Check Disaster-Risk Areas (Hazard Map) Before Buying a House in Japan
How to Check Disaster Risk Areas Before Buying a Home in Japan: A Detailed Guide to Reading Hazard Maps
Japan is renowned as a great place to live, with modern infrastructure, excellent safety, and a civilized environment. Yet there's one reality that anyone planning to settle here long-term must face: natural disasters. Earthquakes, flooding, landslides, and tsunamis aren't just things you see on TV — they're real risks that can directly impact a property worth tens of millions of yen and the safety of your family.
Many Vietnamese homebuyers in Japan tend to focus only on design, distance to the train station, or price, while overlooking the geology and terrain of the surrounding area. Buying a home located in a flood-prone basin or on weak ground can turn your dream home into an enormous financial burden.
📋 Legal regulation: Since August 2020, Japan's Ministry of Land, Infrastructure, Transport and Tourism has enacted a revised law requiring real estate agencies to explain disaster hazard maps as part of the mandatory disclosure of important matters (Juyo Jiko Setsumei - 重要事項説明) before a buyer signs the sale contract. |
However, rather than waiting until the moment you're about to sign to hear this explanation, proactively checking earthquake risk areas and avoiding flood-prone properties from the very start of your search will help you stay in control. This article will guide you through how to read Japan's disaster Hazard Maps in the clearest and most detailed way.
1. What Is a Hazard Map (ハザードマップ)?
A Hazard Map is a type of map that forecasts areas at risk of natural disasters, the estimated extent of damage (such as flood water depth or the scale of a potential landslide), as well as the locations of safe evacuation sites in the event of an emergency.
These maps are built using scientific data, historical geological records, and simulations of the most severe disaster scenarios (for example, a 1-in-1,000-year record rainfall event). In Japan, every ward and city has its own Hazard Map for its area. Checking the Hazard Map is the first and most important screening step to eliminate properties located in dangerous “red zones.”
2. A Step-by-Step Guide to Checking the Core Types of Disaster Risk
When reviewing a disaster map, you need to pay particular attention to the following three major risk categories:
2.1. Flooding (Shinsui - 浸水) and Tsunamis (Tsunami - 津波)
When checking flood risk, the map will display color bands ranging from light to dark, corresponding to the expected water depth in the event of heavy rainfall causing a levee breach or river overflow.
Flood Depth | Map Color | Level of Impact |
Under 0.5 meters | Light yellow | Flooding up to ankle or knee height; the 1st floor may still be safe, but the basement or low-lying belongings will be affected |
0.5 to 3.0 meters | Light pink / Orange | Flooding up to the ceiling of the 1st floor. If you buy a 2-story home, you must evacuate to the 2nd floor when an alert is issued |
Over 3.0 to 5.0 meters or more | Red / Purple | Flooding covers the entire 1st and 2nd floors. An extremely dangerous area — best to avoid buying property here entirely |
2.2. Landslides (Dosasaigai - 土砂災害)
If you're considering a home in the suburbs, near hills or mountains, or on sloped terrain, be sure to carefully check the landslide warning zones (土砂災害警戒区域).
Warning Color | Danger Level |
Yellow zone | An area where a landslide could pose a risk to residents' lives |
Red zone | A particularly hazardous area, where landslide debris could completely destroy the structure of an ordinary wooden home |
2.3. Earthquakes (Jishin - 地震) and Soil Liquefaction (Ekijoukagenshou - 液状化現象)
Beyond the intensity of earthquake shaking, there's a particularly frightening hidden risk that few foreigners are aware of: soil liquefaction.
This phenomenon occurs when a strong earthquake strikes soft, sandy ground with a high water table (typically reclaimed land, areas near rivers or the coast, or former marshland that's been filled in). When the ground shakes, underground water is forced upward, turning what was once solid ground into a liquid, mud-like mixture. As a result, the entire foundation of a home can sink unevenly, tilt to one side, or collapse completely — even if the structural frame above is very sturdy.
⚠️ Warning: When checking the map, areas displayed in dark red or orange for liquefaction risk (液状化の可能性が高い) are places you should immediately cross off your buying list — or be prepared to spend a substantial amount of money on specialized pile foundations to support the structure. |
3. Official Tools and Websites for Checking Hazard Maps
To check these risks yourself, you can use two completely free, highly accurate online tools provided directly by the Japanese government.
3.1. The Portal Site of Japan's Ministry of Land, Infrastructure, Transport and Tourism (MLIT)
The website is called the Hazard Map Portal Site (ハザードマップポータルサイト): https://disaportal.gsi.go.jp/
This is a centralized portal containing all of Japan's disaster data. Here, you'll find two main options:
1. Overlapping Hazard Map (重ねるハザードマップ): This is the most excellent and user-friendly tool for foreigners. Simply enter the property's address into the search box, and the map will appear. You can toggle on/off the layers for each type of disaster — flooding (洪水), landslides (土砂災害), and tsunamis (津波) — all on the same interface for a comprehensive overview.
2. Local Hazard Map (わがまちハザードマップ): This option takes you directly to a detailed PDF map published by the local government of each ward or municipality. These files may include detailed guidance in English, along with specific evacuation locations within the area.
3.2. Local geological information websites
If you want to dig deeper into liquefaction risk or detailed earthquake shaking forecast maps down to the neighborhood level, you can search on Google using the following format:
• [Prefecture/City Name] + 液状化マップ (Liquefaction map)
• [Prefecture/City Name] + 地震ハザードマップ (Earthquake hazard map)
For example, if you're buying a home in Tokyo, the Tokyo Metropolitan Government's website has a map that very clearly displays the risk level of each district based on its ancient geological structure.
Conclusion: The Hazard Map — A Shield Protecting Your Investment
Understanding and knowing how to read the Hazard Map is the strongest shield protecting your investment in Japan. A property priced 10% to 20% below market value may very well be hiding an unfavorable disaster profile, sitting in a red flood zone or an area with a high liquefaction risk.
However, reading these specialized maps yourself, filled with complex Japanese terminology, can sometimes cause you to miss critical details — especially data about the historical geology of that specific plot of land.
Found a home you love but aren't confident about the safety of the surrounding ground? Worried there might be unfavorable terms hidden in the broker's important matters disclosure document?
👉 Contact ESTATE PLUS now, or leave your information below this article. Our team of real estate experts will conduct an in-depth geological assessment, thoroughly cross-reference the Hazard Map system, and provide you with the most transparent report, so you can feel completely confident before deciding to buy a home in Japan!
This article is for informational purposes only, compiled based on publicly available data and tools provided by Japanese government agencies. Hazard Map data may be updated over time; please check official websites directly and consult a real estate professional before making a purchase decision.
Related Posts
View all in this category
Step-by-Step Guide to Buying a House in Japan for Foreign Residents
Are you living and working in Japan, dreaming of owning your own home? The process of buying propert...
Cost of Buying a House in Japan: Besides rent, what other expenses do you need to prepare?
Buying a house in Japan, in addition to the rent, you need to prepare an additional 6-10% of the hou...
CONDO OR DETACHED HOUSE? A Detailed Comparison Before Buying Property in Japan
Which is right for you - a CONDO or a HOUSE? Compare management costs, appreciation potential, and p...